Visualization - CEC Potsdam GmbH
Main menu:
Visualization
The Interactive Diagnostic and Presentation Tool (IDP) has been designed to display climate model results by way of maps and diagrams.
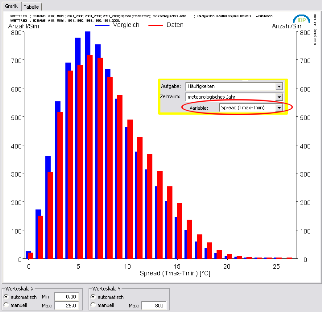
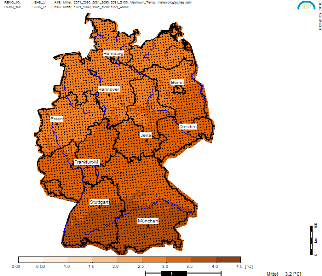
This tools allows to conduct explorative data analyses and visualize their results. Climate variables and their developments can be displayed as graphs or maps (see examples on the right-


Example 1 for a diagram produced by IDP: Frequency distribution of daily temperatur spread at station Hamburg. Comparison between the periods 1971—2000 (blue) and 2071—2100 (red). Regionalization was carried out using WETTREG 2010, driven by the global climate model ECHAM 5, run 1, present time: 20C data, future: scenario A1B.
Example 2 for a map display produced by IDP: Signal of the average daily maximum temperature in Germany. Comparison of the period 1971-
REPORTS
Note: Since the projects were funded by German sources, all reports listed here are in German.
(2015) IDP -
Ein Werkzeug zur explorativen Datenanalyse. Bedienungsanleitung Version 4.0.0.8. Aktualisierung des Berichts: Ableitungen von Transwetterlagen und Entwicklung eines interaktiven Diagnose- und Präsentationstools. Im Auftrag eines Konsortiums aus sieben Bundesländern. (Ansprechpartner: Arne Spekat; Laufzeit des Vorhabens: 01.07.2014 – 01.03.2015) (2014) IDP -
Ein Werkzeug zur explorativen Datenanalyse. Bedienungsanleitung Version 3.6.3. Bericht im Auftrag des Landesamtes für Umwelt, Gesundheit und Verbraucherschutz, Brandenburg, Potsdam OT Groß Glienicke. (Ansprechpartner: Frank Kreienkamp, Arne Spekat; Laufzeit des Vorhabens: 01.07.2014 – 01.10.2014) (2014) IDP -
Ein Werkzeug zur explorativen Datenanalyse. Bedienungsanleitung Version 3.6. Bericht im Auftrag des Landesamtes für Umwelt, Landwirtschaft und Geologie, Sachsen. (Ansprechpartner: Frank Kreienkamp, Arne Spekat; Laufzeit des Vorhabens: 01.03.2014 – 30.06.2014) (2011) IDP -
Ein Werkzeug zur explorativen Datenanalyse. Bedienungsanleitung Version 3.4.0.8 Bericht im Auftrag des Landesamtes für Umweltschutz Sachsen- Anhalt. (Ansprechpartner: Frank Kreienkamp, Arne Spekat; Laufzeit des Vorhabens: 01.02.2011 – 30.06.2011) (2011) Einarbeitung von ASCII-
Datensätzen in das Programm IDP. Bericht im Auftrag des Bayerischen Landesamtes für Umwelt. (Ansprechpartner: Frank Kreienkamp, Arne Spekat; Laufzeit des Vorhabens: 01.05.2011 – 31.10.2011). AZ 81- 4421.9- 33657/2011 (2010) IDP -
Ein Werkzeug zur explorativen Datenanalyse. Bedienungsanleitung Version 3.3.2 Bericht im Auftrag des Hessischen Landesamtes für Umwelt und Geologie. (Ansprechpartner: Frank Kreienkamp, Arne Spekat; Laufzeit des Vorhabens: 01.01.2010 – 30.06.2010) (2009) IDP -
Ein Werkzeug zur explorativen Datenanalyse. Bedienungsanleitung Version 3.3. Bericht im Auftrag des Hessischen Landesamtes für Umwelt und Geologie. (Ansprechpartner: Frank Kreienkamp, Arne Spekat; Laufzeit des Vorhabens: 01.01.2009 – 30.06.2009) (2009) IDP -
Ein Werkzeug zur explorativen Datenanalyse. Bedienungsanleitung Version 3.2.2 Bericht im Auftrag des Landesamt für Natur, Umwelt und Verbraucherschutz Nordrhein- Westfalen. (Ansprechpartner: Frank Kreienkamp, Arne Spekat; Laufzeit des Vorhabens: 01.05.2009 – 30.09.2009) (2008) Einarbeitung der CLM -
Daten ins IDP. Bericht im Auftrag des Landesamtes für Natur, Umwelt und Verbraucherschutz Nordrhein- Westfalen. (Ansprechpartner: Frank Kreienkamp, Arne Spekat; Laufzeit des Vorhabens: 01.04.2008 – 31.08.2008) (2008) IDP -
Ein Werkzeug zur explorativen Datenanalyse. Bedienungsanleitung Version 3.2. Bericht im Auftrag des Landesamt für Natur, Umwelt und Verbraucherschutz Nordrhein- Westfalen. (Ansprechpartner: Frank Kreienkamp, Arne Spekat; Laufzeit des Vorhabens: 01.02.2008 – 30.06.2008) (2008) Klimaauswirkungen und Anpassung in Deutschland – Phase 2: Aufbau eines Fachinformationssystems „Klimaanpassung" (FISKA) im Auftrag des Umweltbundesamtes. (Ansprechpartner: Manfred Stock, Frank Kreienkamp, Arne Spekat; Laufzeit des Vorhabens: 01.01.2008 – 30.09.2008). FKZ 206 41 100
(2007) IDP -
Ein Werkzeug zur explorativen Datenanalyse. Bedienungsanleitung Version 3.0. Bericht im Auftrag des Umweltbundesamtes. (Ansprechpartner: Frank Kreienkamp, Arne Spekat; Laufzeit des Vorhabens: 01.05.2007 – 30.09.2007) (2007) IDP -
Ein Werkzeug zur explorativen Datenanalyse. Bedienungsanleitung Version 2.2. Bericht im Auftrag eines Konsortiums aus sechs Bundesländern. (Ansprechpartner: Frank Kreienkamp, Arne Spekat; Laufzeit des Vorhabens: 01.10.2006 – 30.04.2007) (2007) Anpassungmaßnahmen an Klimaänderung und Fachinformationssystem Klimaanpassung FISKA. Aufbau eines Expertensystems zur Diagnose-
und Präsentation von Klimaszenarien. Im Auftrag des Umweltbundesamtes. (Ansprechpartner: Frank Kreienkamp, Arne Spekat; Laufzeit des Vorhabens: 01.05.2007 – 31.12.2007). FKZ 206 41 100 (2006) IDP -
Ein Werkzeug zur explorativen Datenanalyse. Bedienungsanleitung Version 2.0. Bericht im Auftrag eines Konsortiums aus sechs Bundesländern. (Ansprechpartner: Frank Kreienkamp, Arne Spekat; Laufzeit des Vorhabens: 01.06.2006 – 31.12.2006)